잊어버리기 전에 다시 정리…
python으로 normal distribution 공식과 공식을 통해 해당 값의 frequency를 구해봤다.

공식을 변형해서,
python으로 구현하면 다음과 같다.
import math
import numpy as np

def normal_distribution(x , mean , standard_deviation):
    frequency = (1/(math.sqrt(np.pi*2)*standard_deviation)) * np.exp(-0.5*((x-mean)/standard_deviation)**2)
    return frequency
z-score가 2.45가 나올 때 해당 frequency값을 구하면,
z-score는 평균이 0이고, 표준편차가 1일 때를 기준으로 하기 때문에 다음과 같이 집어넣어서 구할 수 있다.
normal_distribution(2.45, 0, 1)그럼 값은
0.019837354391795313
이 나오고,
지난번 포스팅에서 “해당 값을 표준화 했더니 z값이 2.45, 해당 값이 일어날 확률이 p=.0142가 나왔다.”는
-> “해당 값을 표준화 했더니 z값이 2.45, 해당 값이 일어날 확률이 p=.0198가 나왔다.”로 수정해야한다.
뭔가 계속 찜찜해서 결국 직접 구해봤다.
추가로,
실제 랜덤 데이터로 생성해서 구현했다.
random_number = np.random.normal(0, 1, 100000000)
print(np.mean(random_number))
print(np.std(random_number))
1억 개 정도 normal distribution 정규 분포 형태의 랜덤 데이터를 만들어서 평균값과 표준 편차 값을 확인했다.

1억개 정도 하니 평균은 0, 표준편차는 1에 가까운 값이 나온다. 소숫점 이하의 오차는 갯수가 클 수록 더 작아진다.
import seaborn as sb
from scipy.stats import norm

pdf = norm.pdf(random_number , loc = 0 , scale = 1 )
sb.lineplot(random_number, pdf , color = 'red')
이건 1억개 정도 돌리려고 했는데 램 용량 부족으로 못돌려서 1만개 정도만 돌린 그래프,
pdf는 Probability density function 으로 확률 밀도 함수를 구해서 그래프로 그린 것,
plt로 그래프 그린다고 해도 동일함
import matplotlib.pyplot as plt

count, bins, ignored = plt.hist(random_number, 100, density=True)
plt.plot(bins, 1/(sigma * np.sqrt(2 * np.pi)) * np.exp(-(bins-mu)**2 / (2 * sigma**2) ), linewidth=2, color='r')
plt.show()
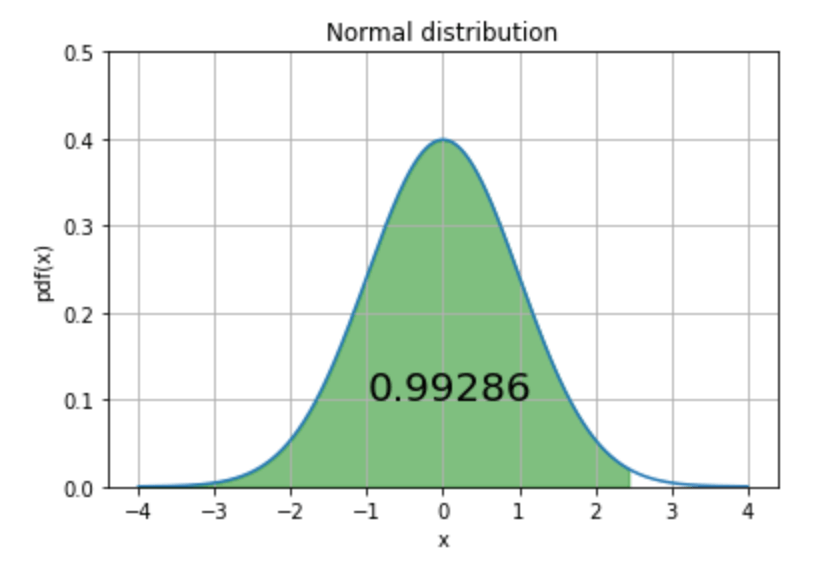
여기에서 cdf 값, Cumulative distribution fuction으로.
누적값으로 z값 2.45까지의 면적 값을 구해보면,
# Library
from matplotlib import pyplot as plt
import numpy as np
from scipy.stats import norm

fig, ax = plt.subplots()

# for distribution curve
x= np.arange(-4,4,0.001)
ax.plot(x, norm.pdf(x))

ax.set_title("Normal distribution")
ax.set_xlabel('x')
ax.set_ylabel('pdf(x)')
ax.grid(True)

# for fill_between
px=np.arange(-4, 2.45,0.01)
ax.set_ylim(0,0.5)
ax.fill_between(px,norm.pdf(px),alpha=0.5, color='g')

# cdf(x) 값 구하기
cdf_x = round(norm.cdf(x=2.45, loc=0, scale=1), 5)

# for text
ax.text(-1, 0.1, cdf_x, fontsize=20)
plt.show()
으로,

z-score가 2.45를 기준으로 좌측 끝 부분부터 해당 값까지의 누적 면적 값… Cumulative 값은 0.993정도가 된다는 것을 추가로 확인했다.
답글 남기기